Kia ora,

We are experiencing technical issues displaying data on some whenua block reports and are currently in the process of fixing this.

If you require a report while this issue is being resolved, please request this from us directly via: TPKinfo@tpk.govt.nz.

We apologise for any inconvenience this may cause.

Updated: 7 January 2025

Mā te whenua e whanake ai te whānau
Search Tupu.nz
Language: English | Māori
Block ID : 4180
Owner Interests : 818
Shares : 32419

Block Name

Tiroa E

Area (hectares)

6084.11

Māori Land Court District

Waikato-Maniapoto

LINZ Certificate of Title

SA51C/863

Icon

Block details

Governance

Governance

Some blocks have a governance structure in place to help make decisions about the whenua - like a trust or incorporation, for example.

Governance structure name(s)
Tiroa E Trust
Governance structure type(s)
Ahu Whenua Trust

Not all whenua needs a formal governance structure, but it can make it easier to make collective decisions and apply for funding.

Next steps

Find out more about governance structures

Find out who the trustees or committee members are

Valuation

Rates

You may need to pay rates on whenua Māori.

Local Councils can decide to postpone collection or not collect rates at all for Māori freehold land that meets certain criteria. You'll need to contact your local council to see if your block qualifies for a postponement, remission, or exemption from rates.

Region 15

Region

There are a number of different agencies you may need to connect with about your block – for information, funding, or resource consents, for example.

Regional Council
Waikato Region
Local Council
Waitomo District
Māori Land Court District
Waikato-Maniapoto
Te Puni Kōkiri region
Waikato-Waiariki

The  team at your nearest Te Puni Kōkiri office can help you and your whānau connect to these other agencies and take the first steps toward developing your whenua.

Next steps

Find your nearest Te Puni Kōkiri office

Find your nearest Māori Land Court office

Find your local or regional council website

Icon

Data sources and information

Māori land data

Māori land data is sourced from the Māori Land Court data service. It was supplied to TPK in September 2022 so some blocks or governance structures may differ from the current Māori Land Court record.

Search Māori Land Online to find current records

View and download Māori freehold land data

Region data

Regional and local council boundary data is sourced from Land Information New Zealand and was published in July 2019.

View and download regional and local council boundary data

Icon

Access

A large number of Māori freehold land blocks are affected by access issues. These could be legal – like if a block is surrounded by other land – or physical – like if a block is too far away from roads, tracks, or markets.

Access issues can make it harder for whānau to connect or reconnect with the whenua. They can also make development more costly or even impossible.

Icon

Access to the block

This section shows how likely it is that a block can be accessed by track or road. It's based on the distance between the whenua and a known track or road, but it doesn't take into account things like rivers, cliffs, or informal tracks across private land.

Estimated road access
High likelihood of direct road access.
Estimated track access
High likelihood of direct road access.

If there is no reasonable access to a block it is considered landlocked. The Māori Land Court can help resolve access issues — for example by creating an easement, which is a right to cross another person's land.

Next steps

Find out more about legal access to Māori land

Contact the Māori Land Court about resolving an access issue

Title improvement [PDF 385KB]

Icon

Access to infrastructure

Transport links are important for getting products to local and overseas markets. If a block is a long way from railway stations, ports, or airports it can be more costly to transport and export products. This section shows the approximate distance in a straight-line from the whenua to important transport infrastructure.

Distance isn't the only important factor for selling or exporting products. Some industries have special requirements for licensing, processing, handling, and exporting that you should be familiar with.

Next steps

Find out if you are ready to start exporting

Find out more about exporting in the primary sector

Find out more about the legal requirements for exporting

Get export help from the New Zealand Trade & Enterprise Māori Business team

Icon

Data sources and information

Estimated access

These estimates are created by measuring the distance in a straight-line from the Māori freehold land block boundary to the nearest road (or legal road parcel) or track. Road and track data is publicly available from Land Information New Zealand (LINZ) and is regularly updated.

    0 - 10m — High likelihood

    10 - 100m — Medium likelihood

    100 - 1000m — Low likelihood

    1000+ — Extremely low likelihood

The estimates are do not take into account private agreements — like easements — or natural features — like cliffs or waterways.

View and download the LINZ NZ Primary Road Parcels layer

View and download the LINZ NZ Roads Addressing layer

View and download the LINZ NZ Track Centrelines layer

Access to infrastructure

These estimates are created by assigning Māori freehold land blocks to circular service areas of various distances around infrastructure points (rail, port, airport). Infrastructure data is publicly available from LINZ.

The estimates do not take into account actual road distance.

View and download LINZ infrastructure data

Icon

Climate

Understanding your climate helps you know what you can and can't do on your whenua. It affects everything from crop growing conditions to tourism. It can also affect costs.

What's the difference between weather and climate?

Weather and climate aren't quite the same thing. Weather is what's happening now – like whether it's hot or cold. Climate is what's been happening for a long time – like how often it tends to be hot or cold and how hot or cold it gets.

The climate information on this page is based on averages for the region. The local climate on the block might be different so you should always check this out before making big decisions about the whenua.

Weather station
Pureora Forest Cws
Distance from block
13 km

New Zealand's climate is expected to change a lot over the next few decades. It is hard to know how climate change will affect land use but it needs to be part of your whenua decision-making.

Next steps

Find out more about climate change

See the latest climate change research and news

Find out more about how climate change could affect primary industries

Adapting to Climate Change: A guide for farmers [PDF 802KB]

Find out more about greenhouse gas emissions from farming

Temperature

Temperature

Air temperature

Air temperature influences what grows and how well. It affects soil chemistry and biology, plant reproduction, how fast water evaporates, and what tourists will need to wear.

Average temperature
13.0 ºC
Lowest recorded temperature
-5.2 ºC
Highest recorded temperature
32.8 ºC

Each plant species has different optimal temperature limits. These can be different for different parts of the plant and at different times of the year.

Next steps

Search the land use fact sheets to find optimal climates

Growing Degree Days

Growing Degree Days

Growing Degree Days (GDDs) measure the amount of heat available for plant and insect growth. GDDs are worked out by adding up the total number of degrees each day is above a certain temperature across a growing season. This threshold is different for each crop but we have used 10ºC because it is a useful indicator for pasture growth.

Growing Degree Days
1609.8

Higher GDDs combined with other favourable growing conditions usually means plants and insects will grow faster.

Next steps

Find out more about Growing Degree Days

Find out Growing Degree Day requirements for different crops

Frost

Frost days

Frost is a thin layer of ice that forms when water vapour settles on a surface that is below freezing. A frost day is when the minimum temperature is below 0ºC.

Frost days
41

Frost affects plants in different ways. Some plants — like vines, tomatoes, and potatoes — can be damaged or killed by even a light frost. Others — like root vegetables and leafy greens — are less affected  and may even benefit from it.

Next steps

Find out more about frost days

Find out which crops might be suitable for the block

Conditions

Solar Radiation

Sunshine

The sun provides energy in the form of heat and light. Plants use this energy to grow and reproduce. It also increases evaporation which dries out soil, and transpiration, which dries out plants.

The amount of sun your whenua receives affects how fast your plants grow and how much they produce. The timing is also important for certain chemical processes — like ripening.

Sunshine hours
1882
Rainfall

Rainfall

Rainfall is the main source of water in soil. Water is critical for plant growth.

Plants draw water from the soil and use it for:

  • cell growth
  • maintaining temperature, and
  • transporting sugars and nutrients.

The timing and volume of rainfall is also important for certain chemical processes. Too much rainfall can cause soils to become too wet to sustain livestock or crops.

Rainfall (mm)
1003 mm
Rain days (>1mm)
118

Rainfall isn't the only way of getting water to plants. The right irrigation can turn areas that are too dry into productive land.

Next steps

Find out more about rainfall in New Zealand

Wind

Wind

Wind affects plants in many ways. At low speeds wind helps young plants grow stronger. At high speeds wind dries plants out faster, reduces leaf exposure to the sun, and can tear off blossoms or damage stalks.

Wind also tends to increase cold. Cold can delay plant growth and maturity. It can also cause stress for animals and increase feed requirements.

Wind speed
15 km/h
Gale days
3

One way to reduce wind effects on crops and animals is to plant a windbreak. The best windbreak trees have dense branches and rough bark. Windbreaks can also channel breezes to cool plants in summer.

Next steps

Find out more about choosing the right trees for sheltering crops

Find out more about shelter requirements for farm animals

Icon

Data sources and information

Climate data

All climate data on this page is publicly available from the National Institute of Water and Atmospheric Research (NIWA) website.

Climate values are mean annual values since 1971 for locations with at least 5 complete years of data. Extreme temperature values are for the entire historic record.

Explore and download NIWA climate data

See NIWA daily climate maps

Water

Icon

Surface water

Surface water means water in lakes, wetlands, rivers, and streams. Surface water may be useful for irrigation but may also increase the costs of developing or farming the whenua.

Water

Waterways

This section estimates the river catchments the block is in and the total length of streams and rivers on the block.

The presence of water on the block does not always mean it is okay to take water. Water resources are managed on a catchment basis by regional councils who may limit or prevent access.

Catchment(s)
Mokau River,Waikato River,Whanganui River
Estimated waterways
184840 m

This data is based on experimental river data from LINZ and Ministry for the Environment. You should always check things out on the ground and with your council before making big decisions.

Next steps

Find your regional council website for information about water rules in your rohe

Find out more about good farming practice for looking after river catchments

Explore New Zealand river catchment data

Search for funding opportunities for water-quality projects

Drainage Classification

Riparian zones

A riparian zone is the area where land meets a lake, wetland, river, or stream. It has an important influence on the health of soil, water, animals, and plants.

Estimated fencing
373430 m
Estimated planting
189 ha

There may be special requirements for fencing or planting riparian zones in your rohe. Sometimes there is funding available for riparian zone projects.

Icon

Groundwater

Groundwater is water that comes from the ground, usually from an aquifer. An aquifer is an underground layer of rock or sediment from which water can be extracted — by drilling a bore for example. Groundwater is used for irrigation, animals, and drinking, especially in places where rivers and streams have lower summer flows.

This section estimates the likelihood of being able to access an aquifer from the whenua and the name of the most likely aquifer (if known).

Aquifer potential
High
Aquifer name
No Data

The presence of an aquifer does not always mean it is okay to take water. Aquifers and bores are managed by regional councils who may limit or prevent access.

Next steps

Find your regional council website

Explore GNS Science groundwater maps and data

Icon

Irrigation

Irrigation means applying water to plants in a controlled way. It is used to address water shortages, prevent frosts, and reduce weed growth. Good irrigation can turn unproductive land into productive land.

Irrigation type
No Data
Irrigated proportion
0 %

Irrigation can be costly and it is hard to estimate whether it is worth it. You should always talk to an expert before making irrigation decisions for the whenua.

Next steps

Find resources and guides about irrigation

Search for funding for irrigation projects

Icon

Data sources and information

Waterways data

Waterway data is derived from Land Information New Zealand (LINZ) NZ River Name Lines (Pilot) dataset published 6 August 2019. Waterways in this dataset are approximate only.

Find out more about the LINZ NZ River Name Lines (Pilot) dataset

Riparian zone data

Estimated riparian fencing data is calculated by multiplying the approximate waterway length (above) by 2 and rounding to the nearest 10m.

Estimated riparian planting data is calculated by applying a 5m buffer zone to all identified waterways (including lakes, wetlands, rivers, and streams) (above) on the block, and summing the area to the nearest 0.01 hectares.

Aquifer data

Aquifer data is derived from GNS Science Aquifer Maps of New Zealand published 2015 and the New Zealand Aquifer Potential Map Version 1.0 published 2017. These maps are preliminary outputs of an ongoing research programme and are not intended for detailed planning or land-management decisions.

Find out more about GNS Science Aquifer Maps of New Zealand

Find out more about GNS Science Aquifer Potential Map

Irrigation data

Irrigation data is derived from the Ministry for the Environment Irrigated Land Area dataset published November 2017. This dataset is combines a number of different data sources, including:

  • farm boundaries (using ownership data from Land Information New Zealand)
  • aerial imagery (high resolution aerial and/or satellite photos)
  • resource consent data (where available)
  • analysis of satellite data (using normalised different vegetation index (NDVI) imagery)
  • agricultural production statistics (sourced from Statistics New Zealand).

Find out more about the Irrigated Land Area dataset

Icon

Land cover

Land cover means the things that are on the land — like plants, rivers, and roads. It can affect a range of things including erosion, nutrient loss, and biodiversity.

Land cover is not the same as land use. Land use is how people use the land — like farming or forestry. Land use can influence land cover but one type of land cover might have many different uses.

Estimated land cover (hectares)

Map and data: LCDB v 5.0, Manaaki Whenua – Landcare Research.

This information comes from the New Zealand Land Cover Database (LCDB) v 5.0. It is created from satellite imagery from 2018 / 2019 so the land cover might be different now.

The LCDB is a good indicator of what's in the area but it's not intended to be accurate for individual properties. You should always check things out on the ground before making big decisions.

Icon

Data sources and information

Land cover data

The land cover data layer is sourced from the New Zealand Land Cover Database version 5.0, Mainland New Zealand, produced by Manaaki Whenua – Landcare Research. It is not modified from the original.

The LCDB v 5.0 was released in January 2020, contains land cover as of late 2018, making it a significant update in showing decline in wetlands, intensification of grasslands, and increase in built-up areas since version 4 (from 2012/13). It is licenced for use under the Creative Commons Attribution 4.0 International

LCDB was created at the scale 1:50,000. This means it may be indicative of what is in the area but is not accurate to a level of detail for farm-planning.

LCDB 5.0 data and associated documentation

New Zealand Land Cover Database Version 2 Illustrated Guide [PDF 13.8MB]

Icon

Land use

Land use means the different ways that people use the land. It can be used to understand trends and as an indication of what might be possible in a rohe. Land use is not the same as land cover. Land use is how people use the land — like farming or forestry. Land use can influence land cover but one type of land cover might have many different uses.

This information comes from the Ministry for the Environment's Land-use and Carbon Analysis System (LUCAS). LUCAS was created to meet New Zealand's reporting obligations under the Kyoto Protocol. It is intended as a way to track land use change over time.

Next steps

Find out more about the drivers of and barriers to land use change

Icon

Data sources and information

Land use data

This data is sourced from the Ministry for the Environment Land Use & Carbon Analysis System (LUCAS). It uses aerial imagery and analysis from 1 December 2016.

Explore and download the LUCAS NZ Land Use Map

LUCAS Satellite Imagery Interpretation Guide [PDF 7.2MB]

Icon

Slope

Slope means how flat or steep the whenua is on average. It affects soil quality, erosion potential, air flow, and costs.

There is a strong relationship between slope and land use. Flat land tends to be more productive for horticulture. Steep land tends to be used for livestock and forestry.

Slope (ha)

Map and data: NZLRI Slope Data reproduced with the permission of Landcare Research New Zealand Limited.

Slope should be treated as a limitation when you are making decisions about the whenua. Hills make it harder to use vehicles or harvest crops, for example.

Next steps

Find out more about how slope affects erosion

Trees for the farm - A decision support tool for farmers [PDF 823KB]

Find out about best-practice for irrigation on hills

Explore and download NZ Land Resource Inventory slope data

Explore and download Land Environments of New Zealand slope data

Erosion

Erosion is what happens when soil moves from one place to another. It is influenced by slope, rainfall, and soil type and can have a major impact on land productivity and costs.

Different parts of the block have different levels of erosion. This section estimates the likely worst erosion on the block.

Erosion
Low, High, Moderate

Erosion control practices depend on the whenua, the climate, and the type of land use.

You should always contact an expert before making big decisions about the whenua. Your local and regional council may have special rules about erosion in your area.

Next steps

Find out more about erosion

Find your local or regional council website

Erosion and climate change [PDF  719KB]

Search for funding opportunities for erosion projects

Icon

Aspect

Aspect (ha)

Aspect means the direction a slope faces. It affects the amount of sun and wind the whenua gets, which in turn affects soil moisture.

Northerly aspects are better for growing and supporting animals because they get more sun. On the other hand they can also be more likely to erode and slip.

Next steps

Find out more about how slope and aspect was important for the location of māra kūmara (kūmara gardens)

Explore and download simplified North/South aspect data for assessing livestock carrying capacity

Icon

Data sources and information

Data sources and information

Slope data

The NZLRI Slope data layer is sourced from the New Zealand Land Resource Inventory Slope dataset, produced by Manaaki Whenua – Landcare Research and is not modified from the original. The NZLRI Slope Data is reproduced with the permission of Landcare Research New Zealand Limited and is licenced for use under the Landcare Data Use Licence v1.2. The data was collected for different areas at different times (between 1973 and 1999).

The NZLRI uses estimates and was created at the scale 1:50,000. It may be indicative of what is in the area but is not accurate to a level of detail for farm-planning.

View and download the NZLRI Slope data

Erosion data

Erosion data is derived from Ministry for Primary Industries (MPI) Erosion Susceptibility Classification. It was updated in March 2018.

This page displays only the worst classification on the block.

Find out more about the Erosion Susceptibility Classification

Aspect data

Aspect data was derived from data collected by NASA's Shuttle Radar Topographic Mission (SRTM) captured by the Space Shuttle Endeavour in 2000.

Explore and download SRTM datasets

Icon

Soil

Soil provides place and sustenance for plants, animals, and people. It is critical to agricultural development and our environment. 

The information in this section can help to start the conversation about soil, but it is not the whole story. You should always check out the situation on the ground and talk to experts before making big decisions about the whenua.

Soil classification (ha)

Maps and data: FSL NZSC Data reproduced with the permission of Landcare Research New Zealand Limited.

The following tabs describe many important attributes of the soil. Understanding your soil means understanding all of these attributes and how they interact. You can then start to make plan for your whenua.

Next steps

Find out more about soil

Find out more about soil and agriculture in New Zealand

Get more detailed soil information and reports from S-map Online (free sign-up required)

Icon

Data sources and information

Soil

The soil classification data layer is sourced from the FSL New Zealand Soil Classification dataset, produced by Manaaki Whenua – Landcare Research. It is not modified from the original. The FSL New Zealand Soil Classification Data is reproduced with the permission of Landcare Research New Zealand Limited and is licenced for use under the Landcare Data Use Licence v1.2. The data was collected for different areas at different times (between the 1960s and 2000).

The FSL uses estimates and was created at the scale 1:50,000. It may be indicative of what is in the area but is not accurate to a level of detail for farm-planning. For more detailed data consider undertaking soil analyses or see S-Map Online.

View and download the FSL Soil Drainage Parameters data and maps

Get more detailed soil information and reports from S-map Online (free sign-up required)

Soil drainage

Drainage is essential for removing excess water from the whenua. Good drainage prevents waterlogging and allows air to reach plant roots. It also influences how fast contaminants like dairy effluent leak into the surrounding environment.

Soil drainage classification (ha)

FSL Soil Drainage Class Data reproduced with the permission of Landcare Research New Zealand Limited.

All of the information on this page is connected and related. For example soil permeability is a major factor in soil drainage classification. The data is accurate to a rohe level so you should always check out the situation on the whenua before making big decisions.

Next steps

View the FSL Soil Drainage Parameters data and maps

Explore or download the FSL Soil Drainage Class dataset

Get more detailed soil information and reports from S-map Online (free sign-up required)

Icon

Permeability

Permeability means how quickly water can move through soil. It is important for plant survival and growth. The more permeable the soil is, the more water is lost to the environment.

Soil permeability (ha)

FSL Soil Permeability Data reproduced with the permission of Landcare Research New Zealand Limited.

You should read this information together with other soil measures, especially soil texture and drainage. For example, if the soil has larger particles it will likely be more permeable.

Next steps

View the FSL Soil Drainage Parameters data and maps

Explore or download the FSL Soil Permeability dataset

Get more detailed soil information and reports from S-map Online (free sign-up required)

Icon

Soil water capacity

Soil water capacity (or plant available water) means how much water the soil can hold for plants to be able to use. It can be a useful indicator of whether the soil will be able to sustain plants through droughts.

Soil water capacity (ha)

FSL Soil Water Capacity Data reproduced with the permission of Landcare Research New Zealand Limited.

You should read this information together with other soil measures. For example, if the soil has a high rooting depth then plants may be able to access more of the available water.

Next steps

View the FSL Soil Drainage Parameters data and maps

Get more detailed soil information and reports from S-map Online (free sign-up required)

Icon

Potential rooting depth

Potential rooting depth means how far into the soil plant roots can go to get water. Roots can be stopped by water, toxic soil, or physical barriers like rocks. Plants with deeper roots can survive better through droughts and storms.

Potential rooting depth (ha)

FSL Potential Rooting Depth Data reproduced with the permission of Landcare Research New Zealand Limited.

You should read this information together with other soil measures. For example, if the soil has a high rooting depth then plants may be able to access more of the available water.

Next steps

View the FSL Soil Drainage Parameters data and maps

Explore or download the FSL Potential Rooting Depth dataset

Get more detailed soil information and reports from S-map Online (free sign-up required)

Icon

Data sources and information

Soil drainage

The soil drainage data layer is sourced from the FSL Soil Drainage Class, FSL Potential Rooting Depth, FSL Soil Permeability Profile and FSL Depth to Slowly Permeable Horizon datasets produced by Manaaki Whenua – Landcare Research. They are not modified from the original. The FSL drainage Data is reproduced with the permission of Landcare Research New Zealand Limited and is licenced for use under the Landcare Data Use Licence v1.2. The data was collected for different areas at different times (between the 1960s and 2000).

The FSL uses estimates and was created at the scale 1:50,000. It may be indicative of what is in the area but is not accurate to a level of detail for farm-planning. For more detailed data consider undertaking soil analyses or see S-Map Online.

View the FSL Soil Drainage Parameters data and maps

Get more detailed soil information and reports from S-map Online (free sign-up required)

Icon

Soil texture

Soil is made up of lots of different-sized particles of sand, silt, clay, and organic material. Soil texture is a way of describing different combinations of these particles.

Soil texture affects drainage, water retention, root growth, and how easy the soil is to work with. Sand particles are larger and create more space in the soil for drainage and air flow. Clay particles are smaller and stickier, but have electric charges that attract nutrients.

The best soils for growing are loams, which are about 40% sand, 40% silt, and 20% clay. Loams hold on to water and nutrients but also also let excess water drain away.

Soil texture (ha)

FSL Topsoil Gravel Content Data reproduced with the permission of Landcare Research New Zealand Limited.

You don't need any special tools to assess the soil texture on your whenua. For some tests all you need is a shovel, a glass jar, and some water. Once you've assessed your soil you'll have a better idea of what will grow or what treatments you might need.

It isn't the end of the world if your soil is too sandy or clayey. You can treat sandy soil with organic matter — like maize stubble — and vegetation cover. You can treat clayey soil with organic matter and lime.

It may take a few years but with good management you can still make productive use of non-ideal soil.

Next steps

Find out how to measure your own soil structure and texture

Use a tool to assess the soil quality of your samples

View the FSL Soil Physical Characteristics data and maps

Download Manaaki Whenua soil assessment field guides

Icon

Rock outcrops and surface boulders

Rocks can make it harder to work the whenua because they block vehicles and equipment. You may need to remove them completely for roads, irrigation, or buildings. This can increase costs.

Rock outcrops and surface boulders (ha)

FSL Rock Outcrops and Surface Boulders data reproduced with the permission of Landcare Research New Zealand Limited.

Next steps

See rock outcrops and surface boulder data on a map

View the FSL Soil Physical Characteristics data and maps

Search for funding for whenua improvement projects

Icon

Data sources and information

Soil texture

The soil texture data shown on this page is sourced from the FSL Topsoil Gravel Content, FSL Rock Outcrops and Surface Boulders and FSL Particle Size datasets. FSL texture datasets are produced by Manaaki Whenua – Landcare Research. They hare not modified from the original datasets. The FSL texture data is reproduced with the permission of Landcare Research New Zealand Limited and is currently licenced for use under the Landcare Data Use Licence v1.2. The data was collected for different areas at different times (between the 1960s and 2000).

The FSL uses estimates and was created at the scale 1:50,000. It may be indicative of what is in the area but is not accurate to a level of detail for farm-planning. For more detailed data consider undertaking soil analyses or see S-Map Online.

View and download the FSL Soil Physical Characteristics data and maps

Get more detailed soil information and reports from S-map Online (free sign-up required)

Icon

Soil chemistry

Map and data: FSL Data reproduced with the permission of Landcare Research New Zealand Limited.

Most of New Zealand's soils are missing important nutrients because of the way we've used land in the past. The most important nutrients are:

- Nitrogen

- Phosphorous

- Potassium, and

- Sulphur.

If you understand the state of the soil on your whenua you can make better decisions about how to treat it — with fertiliser for example.

Next steps

Find and download soil fertility booklets for different types of land use

Find a certified Nutrient Management Adviser

Icon

Soil pH

Acidity affects how easy it is for plants to get nutrients from the soil. It is described using a measure called pH.

Soil with low pH is acidic; soil with high pH is alkaline. Most plants prefer soil with neutral pH (between 6.2 - 7.0) but some plants — like blueberries — prefer acidic soil.

Acidity (ha)

Maps and data: FSL pH Data reproduced with the permission of Landcare Research New Zealand Limited.

Soil pH Acidity Affect on plant growth
High  Alkaline May seriously limit plant growth
Moderately High Slightly alkaline May restrict nutrients and growth
Near Neutral Near neutral Satisfactory for many plants
Moderately Low Neutral May restrict earthworm numbers, microbial activity, and nutrient cycling
Low Acidic

May restrict growth due to toxic levels of aluminium

Very low Very acidic May seriously limit growth due to toxic levels of manganese and aluminium

You can use lime to correct acidic soil, and organic matter for alkaline soil. Soil will also naturally return to neutral pH with rainfall and time.

Next steps

Search the land use factsheets to find out soil requirements for different crops

View and download the FSL pH dataset

Icon

Phosphate retention

Phosphorous is an element that is essential to plant and animal growth. In nature, phosphorous occurs as phosphate minerals.

Phosphate retention is a measure of how well soil absorbs and holds onto phosphates. Soils with low phosphate retention tend to leach and may require topping up with fertiliser. Soils with high phosphate retention however can prevent plants from accessing phosphates.

Phosphate retention (ha)

FSL Phosphate Retention Data reproduced with the permission of Landcare Research New Zealand Limited.

Next steps

Explore or download the FSL Phosphate Retention dataset

Icon

Data sources and information

Soil chemistry

The soil chemistry data shown on this page is sourced from the FSL pH, FSL Salinity, FSL Cation Exchange Capacity, FSL Soil Carbon and FSL Phosphate Retention datasets. FSL chemistry datasets are produced by Manaaki Whenua – Landcare Research. They are not modified from the original datasets. The FSL chemistry Data is reproduced with the permission of Landcare Research New Zealand Limited and is currently licensed for use under the Landcare Data Use Licence v1.2. FSL data was collected at different times for different places (between the 1960s and 2000).

The FSL uses estimates and was created at the scale 1:50,000. It may be indicative of what is in the area but is not accurate to a level of detail for farm-planning. For more detailed data consider undertaking soil analyses or see S-Map Online.

View and download the FSL Soil Physical Characteristics data and maps

Get more detailed soil information and reports from S-map Online (free sign-up required)

Icon

Land use capability

The map above shows the Land Use Capability (LUC) Classification for the rohe your block is in. The LUC combines a range of different information about the whenua, including:

  • Rock and soil type
  • Slope and erosion
  • Land cover and vegetation
  • Land use, and
  • Climate.

Putting all these together gives an estimate of how well the whenua can support agriculture.

It's important to remember that this data only describes the whenua as it was when the information was collected. It doesn't take into account things you can do to improve it — like irrigation or fertiliser.

Land use capability (ha)

Map and data: NZLRI LUC Data reproduced with the permission of Landcare Research New Zealand Limited.

Even if your whenua has limitations there might be other options. You might be able to deal with soil issues by applying lime or fertiliser, for example.

You can see land use fact sheets for your region below.

Next steps

Search for other land use fact sheets

Find out more about planning for future change

See videos and read case studies about Māori land owners who changed their land use

Icon

Land use fact sheets

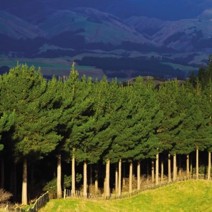
Forestry: Introduction to plantation forestry

There are many reasons to plant trees on your whenua, including commercial harvesting, ecological restoration and protecting waterways. This fact sheet focuses on plantation forestry with the end goal of harvesting timber and carbon credits for a profit.
Read Fact Sheet

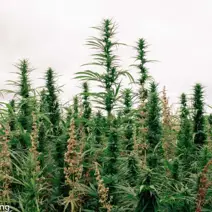
Industrial hemp for seed or fibre

Industrial hemp is promoted as a sustainable crop, because it can sequester large amounts of carbon dioxide and produce environmentally friendly food and fibre products.
Read Fact Sheet

Macadamia nuts

Macadamia nuts have been grown commercially in New Zealand since the 1970s.
Read Fact Sheet

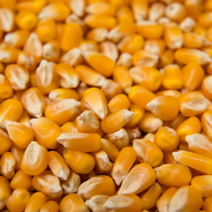
Maize grain

Maize can be grown for silage or for grain. This fact sheet looks at maize grown for grain.
Read Fact Sheet

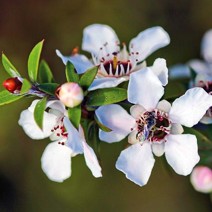
Mānuka for honey or oil

Mānuka is one of the most abundant New Zealand native shrubs. It is a fast growing, conical-shaped bush that can range from creeping matted plants to trees reaching 8m high.
Read Fact Sheet

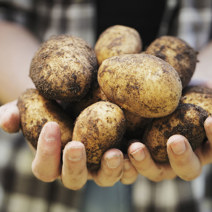
Potatoes

New Zealand uses more land for growing potatoes than any other crop, with over 10,000 hectares grown by 175 commercial potato growers each year.
Read Fact Sheet

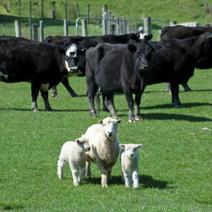
Sheep and beef

Sheep and beef farming is an agricultural staple in New Zealand. There are approximately 23,400 sheep and beef farms throughout New Zealand, covering 45% of our total agriculture area. While there is variation in the type of livestock run on a sheep and beef farm, most farms are centred around sheep and cattle.
Read Fact Sheet

Squash

Buttercup squash are mostly grown in the Hawke's Bay and Gisborne. Most of the crop is exported to Japan and Korea where it’s a dietary staple.
Read Fact Sheet
Icon

Papakāinga

Developing a papakāinga on your whenua can be a way to help whānau with quality affordable housing and to provide ongoing accommodation and/or revenue for future generations.

Setting up a papakāinga can be a long process, but there's help available as you work through it. 

What's a papakāinga?

When we talk about a papakāinga on this website, we mean a group of 3 or more houses, built on whenua Māori, operating as an intentional community according to kaupapa Māori.

Papakāinga also reflect a whānau support system — the kāinga are more than physical structures. They provide opportunities for whānau to strengthen connections between generations, reinforce cultural and spiritual identities, and revitalise Te Reo Māori.

However, barriers like planning restrictions, lack of infrastructure and getting consent from multiple owners can make development a long and sometimes difficult process.

For some landowners it can be a multi-generational venture, so it's good to involve rangatahi in the process too.

Funding help

Te Puni Kōkiri Māori Housing Network supports individuals, whānau, hapū, iwi and rōpū with information, advice and practical support to improve and develop whānau housing.

The Kāinga Whenua Programme provides loans to whenua Māori trusts and individuals with a right to occupy their multiple-owned Māori land.

There is also papakāinga funding and advice available from a range of sources like local councils.

Next steps

Find out more about papakāinga

Find out more about the Māori Housing Network

Find out more about the Kāinga Whenua Programme

Search for papakāinga funding opportunities

A Guide to Papakāinga Housing [PDF 12MB]

Icon

Capital and funding opportunities

Once you have an idea you'll need a business plan and pūtea to make it happen. There are four main ways of funding land projects:

  • Within the whānau or with your trust or incorporation's cash reserves
  • A loan from a lending institution — like a bank or building society
  • External investment or partnership, or
  • Government grants or funding.

Some funding sources will also help your whānau with feasibility studies.

Next steps

Find out more about developing a business plan

Find out more about preparing a funding or investment application

Search for funding opportunities

Icon

Data sources and information

Land Use Capability (LUC)

The land potential data layer is sourced from the New Zealand Land Resource Inventory Land Use Capability dataset, produced by Manaaki Whenua – Landcare Research. Some category labels and groupings are modified from the original. The LUC uses aerial photography, research, and fieldwork to estimate the ability of land to sustain agricultural production and combines a range of datasets from the New Zealand Land Resource Inventory. These include

  • rock type
  • soil
  • slope
  • erosion
  • vegetation
  • climate, and
  • past land use.

The NZLRI Land Use Capability Data is reproduced with the permission of Landcare Research New Zealand Limited and is currently licensed for use under the  Landcare Data Use Licence v1.2. The NZLRI data was collected at different times for different places (between 1973 and 1999).

The NZLRI uses estimates and was created at the scale 1:50,000. It may be indicative of what is in the area but is not accurate to a level of detail for farm-planning. For more detailed data consider a farm scale assessment.

Explore and download the NZLRI Land Use Capability dataset

Land Use Capability (LUC) Survey Handbook, 3rd edition [PDF 2.2MB]

LRIS Data Dictionary version 3 [DOCX 213KB

Icon

Indigenous forest regeneration

Map and data: Potential Vegetation of NZ Data reproduced with the permission of Landcare Research New Zealand Limited.

The map above uses variables like climate, soil, and slope to predict the type of indigenous forest that will thrive in the rohe. 

Deciding to retire whenua and regenerate indigenous forest is a big decision for whānau. Regeneration projects can be complex and you might need to seek advice from other agencies or forestry experts. 

Next steps

Find out more about indigenous forestry in New Zealand

Search for forestry funding opportunities

Icon

Data sources and information

Indigenous forest potential data

The indigenous forest potential data layer is sourced from the Potential Vegetation of New Zealand dataset, produced by Manaaki Whenua – Landcare Research. It has not been modified from the original. This dataset was completed in 2004 and uses a range of variables and statistical analyses to predict New Zealand's potential indigenous forest composition. Potential Vegetation of New Zealand Data is reproduced with the permission of Landcare Research New Zealand Limited and licenced for use under the Landcare Data Use Licence v1.2.

The Potential Vegetation of New Zealand dataset uses estimates only. It may be indicative of what is in the area but is not accurate to a level of detail for farm-planning. For more detailed data consider a farm scale assessment.

View and download the Potential Vegetation of New Zealand dataset

Waikato

Waikato

The Waikato region descends from Ruapehu and spreads across the North Island. Its diverse geography includes steep forested hill country in the South, rugged coastal hills in the East and West, and large floodplains. Waikato tends to have hot summers and mild winters, with high year-round rainfall. This makes it ideal for dairying and other pastoral uses. Other industries include deer, goat, and pig-farming, and a variety of crops, including feed maize. Tourism is also significant.
Icon

People (2018 Census)

Population
413157
Identify as Māori
91299
Identify as Māori %
22.1 %

Note that people can record that they identify as multiple ethnicities in the census.

Icon

Māori freehold land

Māori freehold land blocks
3861
Māori freehold land area
310435 ha
Icon

Social (2018 Census)

Households

Households
150162
Median personal income
$30,400
Households renting
29.7 %
Median weekly rent
$250
Household mobile phone access
78.2
Household internet access
67.4 %

Highest Qualification

Employment status

Icon

Data sources and information

Population, household, education, and employment data

Population, household, and education data is sourced from the New Zealand Census 2018.

Find out more about the census

View and download 2018 census data

Māori land data

Māori land data is sourced from the Māori Land Court data service. It was supplied to TPK in September 2022 so some blocks or governance structures may differ from the current Māori Land Court record. 

Search Māori Land Online to find current records

View and download Māori freehold land data

Icon

Tourism

Another land-use option for the whenua is tourism. This is a broad category and could include anything from accommodation and food services to whale watching.

The graphs below show trends in your region for visitors and spending. A common pattern in many regions is that most visitor spending is on peripheral activities like transport, hospitality, and accommodation.

Visitor numbers

Visitor spend

Icon

Data sources and information

Tourism visitor data

Tourism visitor data was derived from MBIE International Visitor Survey.

Find out more about the International Visitor Survey

Tourism spend data

Tourism spend data is sourced from the Ministry of Business, Innovation, and Employment (MBIE) tourism research and data. The data on this page was published February 2019.

View and download MBIE tourism datasets

About this report

Te Puni Kōkiri wants to help whānau to start and continue conversations about the whenua. Sometimes that can be hard — whānau often live a long way from the block or don't have access to land information.

This report is an overview of a selected Māori freehold land block. It brings together data and information from a range of places including:

Māori Land Court

Manaaki Whenua Landcare Research

Ministry for the Environment (MfE)

Land Information New Zealand

GNS Science

It also includes links to helpful tools and resources.

Understand the limitations of this report

The goal of this report is to provide general information to help start and inform conversations. It is not comprehensive or detailed enough to support detailed decision-making.

The information in this report comes from lots of different places. Some datasets are older than others but are still useful to get an idea of what might be possible or not.

You should always check things out on the ground before making big decisions.

Review the Tupu.nz general disclaimer that also applies to this report

Review the Tupu.nz copyright information that also applies to this report

Get advice from experts

Kaimahi at Māori Land Court can help with information about your options with formal governance structures.

Te Puni Kōkiri also have regional advisers who can visit your whenua and help you work out what the best option might be.

You could also get advice from other experts, like land advisors, financial advisors, lawyers, and other trusts. There may be funding available to help with this.

Next steps

Consider the potential of the whenua

Work out whānau aspirations for the whenua

Search the land use fact sheets

Search for funding opportunities

Contact the Māori Land Court

Find your local Te Puni Kōkiri office


Up Arrow
Back to top